Fourier transform is an effective tool in image processing. But the only way for it to be effectively used is if we know how certain patterns appear in frequency space. So we try to imagine a few patterns common in images.
Figure 5: Two dots (left) and FFT (right)
These pattern will be very useful in future exercises, specially the two dots Fourier transform. If we look at the FFT of the image of two dots we see a sort of sinusoid wave along the x-axis. If we recall the concepts of Fourier Transform, we know that the Fourier transform of a Fourier transform is the original function. This means that if we Fourier transform an image of a sinusoid wave, we will revert back to an image of two dots.
So let us examine the properties of the FFT of a sinusoid.

Figure 6: Sinusoid with Pi Frequency (left) and FFT (right)
One basic property is varying the frequency of the sinusoid. As we can see, as you increase the frequency of the sinusoid the distance between the dots increases. Meaning that the distance between the dots is dependent on the frequency of the sinusoid. If we remember our lessons in Fourier Transform, we know that the result is a dirac delta on the frequency and negative frequency of the sinusoid. Meaning that the distance between the two dots is equal to twice the frequency of the sinusoid.
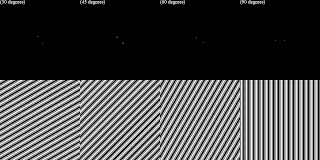
Another property we want to find out is what happens if we rotate the pattern. Again, knowledge from Fourier transforms tells us that by rotating the sinusoid, we will rotate the two dots around the origin while maintaining the distance between them. So lets try it out.
Figure 10: Sinusoid Rotations and Corresponding FFT
Here, we can see the motion of the dots relative to the rotation of the sinusoid. So we can see that the rotation of the dots is equal to the rotation of the sinusoid.
Finally, we want to see how to compute the frequency from the Fourier Transform of a sinusoid image. Included below is a short algorithm to generate a sinusoid with an AC Bias, Fourier transform it and get the frequency of the signal.
//Sinusoid With AC Bias
counter = 0; frequency = 32; noise = 1; radius = 0.03
nx = 300; ny = 300;
x = linspace(-1,1,nx);
y = linspace(-1,1,ny);
[X,Y] = ndgrid(x,y);
A = sin(frequency*%pi*Y)+sin(noise*%pi*Y);
xset('window', counter);
imshow(A, []);
// imwrite(A, 'C:\Users\Amelie\Desktop\Properties of Fourier Transform\Sinusoid with frequency ' + string(frequency) +'.bmp');
counter = counter + 1;
xset('window',counter);
A = abs(fftshift(fft2(A)));
r= sqrt(X.^2 + Y.^2);
//Filtering
A(find(r
A = (A - min(A))/(max(A)-min(A));
imshow(A, []);
//imwrite(A, 'C:\Users\Amelie\Desktop\Properties of Fourier Transform\Sinusoid fft with bias.bmp');
counter = counter + 1;
//Finding the Frequency
xset('window', counter);
A = im2bw(A,0.5);
imshow(A, []);
for i = 1:nx
for j = 1:ny
if A(i,j) == 1
ycoor = j;
xcoor = i;
end
end
end
So we start with generating a signal with an AC bias. We superimpose a sinusoid wave with another sinusoid wave of a lower frequency. Here we use signal frequency of 32 Pi and a bias frequency of Pi. Next we filter the bias. Since we know that the frequency of the bias is very small, we can create a circular mask at the center of the image that will remove any frequency with in the mask. Now, if we adjust the radius of the mask we can isolate the signal from the bias. This concept is the same for DC Bias since we can consider is as an AC Bias with frequency of zero. Once we have isolated the signal, we get the location of the dots. We can do this by reducing the image to single pixel dots and finding the coordinates of that pixel. Then we subtract half of the column length to the column coordinate of the dot. This will give us the distance from the center of the image and the frequency of the sinusoid signal.
For this exercise, I give myself a grade of 8 because of the lateness of the submission.


No comments:
Post a Comment